
“I always wondered why somebody didn’t do something about it, then I realized… I am somebody”
Other Facts About the 2019 Homeless Population in Los Angeles County:
- 9% are under age 18.
- 31% are female.
- 15% are in family units (often headed by a single mother}.
- 16% are physically disabled.
- 28% are chronically homeless.
- 15% of homeless population have substance abuse disorders.
- 25% of homeless population suffers from serious mental illness.
- 7% of homeless population were victims of domestic/intimate partner violence.
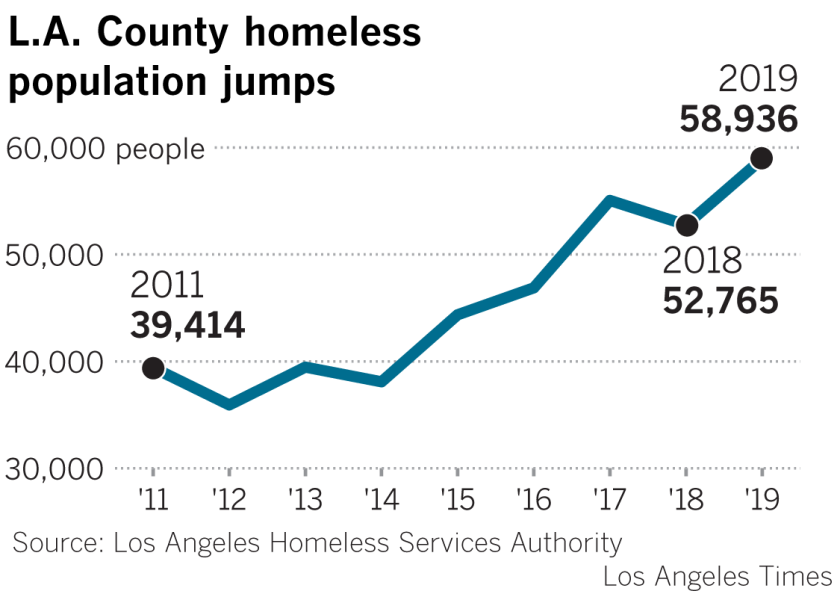
Homeless Population Counts By the Los Angeles Homeless Services Authority
| Year | City of Los Angeles | All Los Angeles County | ||||
|---|---|---|---|---|---|---|
| Total | Unsheltered | Sheltered | Total | Unsheltered | Sheltered | |
| 2019 | 36,600 | 27,221 | 9,079 | 58,936 | 44,214 | 14,722 |
| 2018 | 31,285 | 22,887 | 8,398 | 52,765 | 39,396 | 13,369 |
| 2017 | 34,189 | 25,237 | 8,952 | 57,794 | 42,828 | 14,966 |
| 2015 | 25,686 | 17,687 | 7,999 | 44,359 | 31,018 | 13,341 |
| 2013 | 22,993 | 14,968 | 8,025 | 39,463 | 25,136 | 14,327 |
| 2011 | – | – | – | 39,135 | 20,517 | 19,176 |
| 2009 | – | – | – | 38,602 | 21,073 | 16,745 |
| 2007 | – | – | – | 52,956 | 39,168 | 13,788 |
| 2005 | – | – | – | 65,287 | 53,429 | 11,858 |
| Year | Antelope Valley (SPA 1) | San Fernando Valley (SPA 2) | San Gabriel Valley (SPA 3) | Metro LA (SPA 4) | West LA (SPA 5) | South LA (SPA 6) | East LA County (SPA7 ) | South Bay/ Harbor (SPA 8) |
|---|---|---|---|---|---|---|---|---|
| 2019 | 3,293 | 7,804 | 4,479 | 16,401 | 5,223 | 9,629 | 5,040 | 4,388 |
| 2018 | 3,203 | 7,738 | 4,282 | 14,218 | 4,401 | 8,343 | 4,569 | 6,011 |
| 2017 | 4,559 | 7,459 | 3,552 | 15,393 | 5,511 | 9,243 | 5,189 | 4,282 |
| 2015 | 2,818 | 5,216 | 3,093 | 11,681 | 4,276 | 7,513 | 3,571 | 3,006 |
| 2013 | 2,113 | 4,836 | 2,794 | 10,472 | 3,667 | 7,045 | 2,429 | 2,168 |
| 2011 | 1,412 | 3,720 | 2,499 | 10,086 | 3,512 | 7,541 | 3,208 | 2,644 |
| 2009 | 1,609 | 3,312 | 2,780 | 10,339 | 3,738 | 5,504 | 2,993 | 2,401 |
| 2007 | 1,238 | 4,464 | 6,648 | 16,109 | 4,580 | 7,786 | 3,806 | 3,806 |
| 2005 | 2,404 | 8,051 | 7,145 | 14,041 | 4,773 | 11,919- | 4,982 | 5,918 |
Map of Los Angeles County Service Planning Areas
Percentages in tables that follow are against total homeless population for that specific geographic.
| Race/Ethnic Group | City of Los Angeles | All County of Los Angeles* | ||
|---|---|---|---|---|
| 2019 | 2018 | 2019 | 2018 | |
| American Indian/Alaska Native | 530 (1.4%) | 324 (1.0%) | 972 (1.6%) | 565 (1.1%) |
| Asian | 297 (0.8%) | 352 (1.1%) | 453 (0.8%) | 545 (1.0%) |
| Black/African American | 13,719 (37.5%) | 12,235 (39.1%) | 18,756 (31.8%) | 17,825 (33.8%) |
| Hispanic/Latino | 12,442 (34.0%) | 10,813 (34.6%) | 20,504 (34.8%) | 17,540 (33.2%) |
| Native Hawaiian/Other Pacific Islander | 102 (0.3%) | 77 (0.2%) | 313 (0.5%) | 221 (0.4%) |
| White | 8,228 (22.5%) | 6,978 (22.3%) | 13,860 (23.5%) | 12,538 (23.8%) |
| Multi-Racial/Other | 982 (2.7%) | 506 (1.6%) | 1,399 (2.4%) | 721 (1.4%) |
| Age Group/Percentage | City of Los Angeles | All County of Los Angeles* | ||
|---|---|---|---|---|
| 2019 | 2018 | 2019 | 2018 | |
| Under 18 | 3,368 (9.2%) | 3,022 (9.7%) | 5,280 (9.0%) | 4,974 (9.4%) |
| 18 – 24 | 2,297 (6.3%) | 2,052 (6.6%) | 3,635 (6.2%) | 3,098 (5.9%) |
| 25 and Over | 30,635 (83.7%) | 26,211 (83.8%) | 50,021 (84.9%) | 44,693 (84.7%) |
| Characteristic/Percentage | City of Los Angeles | All Los Angeles County*** | ||
|---|---|---|---|---|
| 2019 | 2018 | 2019 | 2018 | |
| Veterans | 2,221 (6.1%) | 2,048 (6.5%) | 3,879 (6.6%) | 3,886 (7.4%) |
| Chronically Homeless Individuals | 10,076 (27.5%) | 8,360 (26.7%) | 15,855 (26.9%) | 13,559 (25.7%) |
| Chronically Homeless Family Members | 406 (1.1%) | 278 (0.9%) | 674 (1.1%) | 516 (1.0%) |
| Substance Use Disorder** | 4,884 (13.3%) | 4,738 (15.1%) | 7,829 (13.3%) | 7,117 (13.5%) |
| Persons with HIV/AIDS** | 873 (2.4%) | 588 (1.9%) | 1,309 (2.2%) | 740 (1.4%) |
| Serious Mental Illness** | 8,796 (24.0%) | 7,843 (25.1%) | 13,675 (23.2%) | 12,748 (24.2%) |
| Physical Disability** | 6,099 (16.7%) | 4,391 (14.0%) | 9,232 (15.7%) | 6,756 (12.8%) |
| Developmental Disability** | 3,089 (8.4%) | 1,764 (5.6%) | 4,370 (7.4%) | 2,530 (4.8%) |
| Domestic Violence Experience** | 12,876 (35.2%) | 9,088 (29.0%) | 20,265 (34.4%) | 13,374 (25.3%) |
| Homeless Due to Fleeing Domestic Violence** | 1,870 (5.1%) | 1,913 (6.1%) | 3,940 (6.7%) | 3,076 (5.8%) |
* Accumulated numbers for all Service Planning Areas. These do not include numbers for Pasadena, Glendale and Long Beach.
** Percentage is prevalence in homeless population age 18 and over.
*** All numbers are county-wide except for Physical Disability, Developmental Disability, and Domestic Violence Experience. These numbers do not include Pasadena, Glendale and Long Beach.
The 2019 homeless count by the Los Angeles Homeless Services Authority found countywide 66 unaccompanied homeless minors (under age 18) (63 in 2018) of which 45 were unsheltered (28 in 2018); 2,134 unsheltered transitional age youth (age 18-24) (1,577 in 2018); and 1,511 sheltered transitional age youth (1,521 in 2018).
The 2019 homeless count in Los Angeles County found 16,528 people living in motor vehicles (including recreational vehicles or campers). In 2018, 15,748 were counted.